


Black Friday, the annual retail bonanza that sends shoppers into a buying frenzy, is no longer just about slashed prices and doorbuster deals. It’s become a data goldmine for stores, offering a treasure trove of insights into customer behaviour. But with mountains of data and complex buying patterns, deciphering these insights can be a daunting task. This is where machine learning steps in, transforming Black Friday into a data-driven playground for retailers. In this blog we will explore how ML can help in driving superior ML in decision making by accelerating analysis.
Explore Improved Data Analytics with Niveus
Black Friday presents a unique opportunity for retailers to boost sales and generate significant revenue. This requires a nuanced approach that balances immediate gains with long-term customer satisfaction. The treasure trove of data that is ripe for mining key insights.
Maximise Black Friday Sales By Leveraging Machine Learning Model
During black friday, customers have the chance to benefit from improved discounts on desired products. Concurrently, stores aim to boost profits while providing enticing discounts. Understanding customer purchasing patterns across products enables stores to tailor strategies for sales, inventory management, discounting, and customer relations. This analysis aids in formulating effective approaches to achieve both customer satisfaction and profitability goals.
The business goal would be to maximise Black Friday sales while ensuring high levels of customer satisfaction. By analysing historical data, these models can identify trends and predict future customer buying behaviours, allowing retailers to optimise inventory levels and tailor discounts more effectively. Additionally, machine learning can enhance personalization by recommending products to customers based on their preferences and previous purchases, thus increasing the likelihood of sales and improving the overall shopping experience.
Boosting Profits and Customer Satisfaction with Machine Learning Insights
Diving into the extensive Black Friday dataset – which captures customer purchases during the renowned sales event at a chain of retail stores – reveals a wealth of information across diverse cities and demographics. Boasting 12 columns, approximately 550,000 rows, and a size of around 40 MB, the dataset presents a formidable challenge for conventional analytical approaches. Analysing sales data requires a nuanced understanding of various factors influencing purchases, identification of sales trends, and demographic insights. The sheer volume of data amplifies the complexity of this task, rendering manual or traditional methods inadequate in addressing multifaceted aspects.
Enter machine learning – a powerful solution capable of efficiently and promptly handling this colossal task, offering the potential for superior outcomes in unravelling intricate sales dynamics and informing strategic decisions for Black Friday sales and beyond.
Machine learning algorithms excel at parsing through vast datasets like the Black Friday sales data, identifying patterns and customer preferences that are not immediately obvious. By leveraging these insights, retailers can offer highly targeted promotions and personalised shopping experiences, leading to increased profits and heightened customer satisfaction.
How the Machine Learning Model Addresses the Business Goal
The regression model was considered the best fit for the business goal aimed at predicting customer purchases on Black Friday and gaining insights into product preferences. Various regression models within machine learning solutions were explored to achieve this objective. Several strategic suggestions were proposed for the stores to enhance their Black Friday sales:
- Personalised Marketing: Leveraged purchase history and demographics for tailored recommendations
- Loyalty Programs: Enhanced programs aimed at boosting repeat purchases among key demographics
- Dynamic Pricing: Adjusted prices and timed promotions to target peak buying times across demographics
- Digital Outreach: Focused on online and mobile channels to engage younger customers
Data Exploration: Revealing Trends in Customer Behavior and Pricing Strategies
Let’s take a detailed look at the diverse methods of data exploration employed to unveil concealed patterns and trends within datasets. Exploring descriptive statistics, trend analysis, comparisons, and hypothesis formulation collectively contribute to constructing a thorough depiction of the market landscape. This in-depth examination yields valuable insights into customer behaviour, pricing strategies, and the overall dynamics of the transportation sector.
Types of Data Exploration Performed
Customer Insights Based on Gender
Males exhibited higher spending patterns and made more significant purchases compared to females. The code image 1 and figure 1 shows the average purchase for gender. The code image 2 and figure 2 shows the count of purchase for gender.
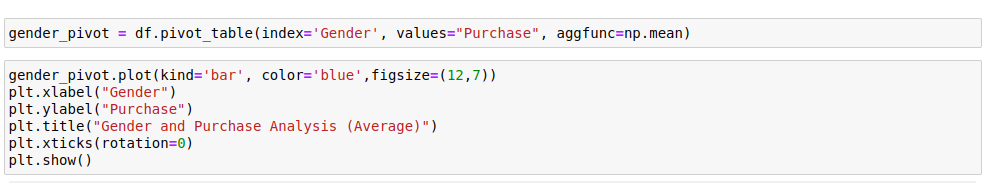
Code image 1: Average of purchase for Gender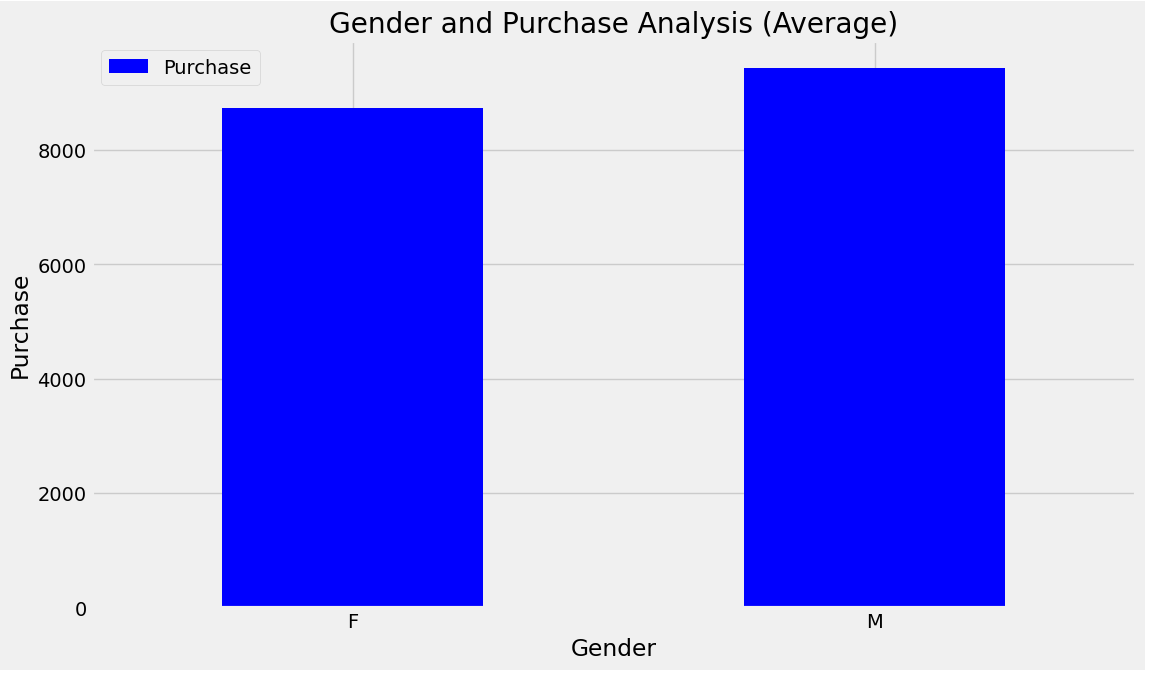
Figure 1: Average of purchase for Gender
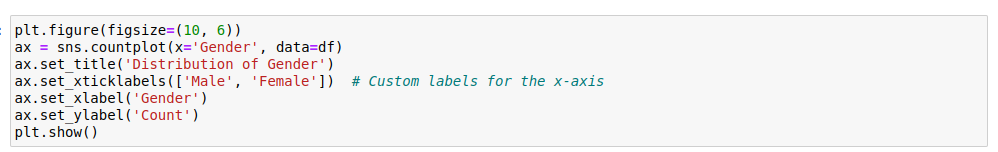
Code image 2: Count of purchase for Gender
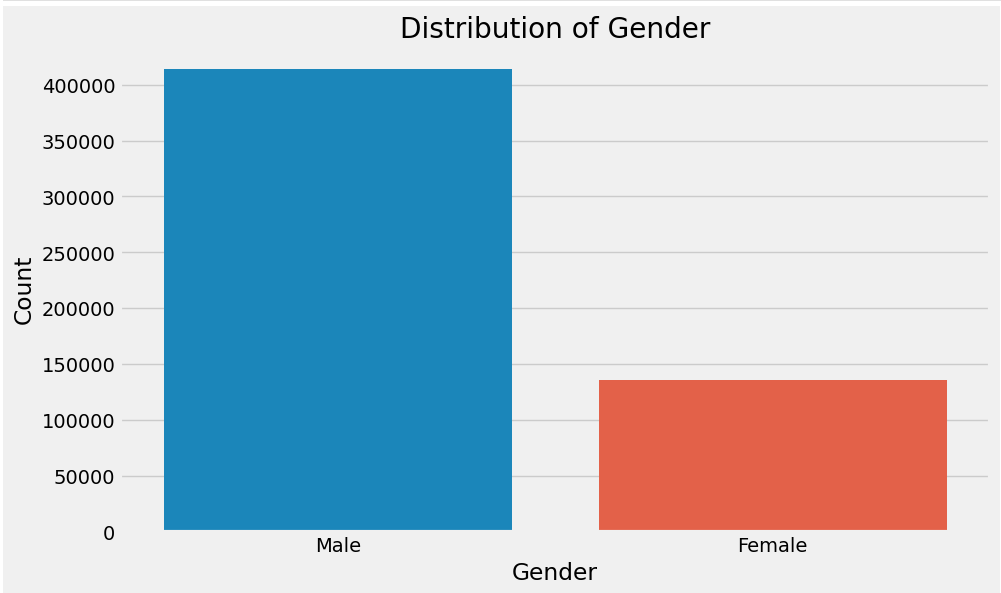
Figure 2: Count of purchase for gender
Customer Insights Based on Age
Males exhibited higher spending patterns and made more significant purchases compared to females. The code image 3 and Figure 3 shows the average purchase for age. The Code Image 4 and Figure 4 shows the count of purchase for age. The age group 26-35 exhibited higher spending, followed by 36-45 and 18-25. 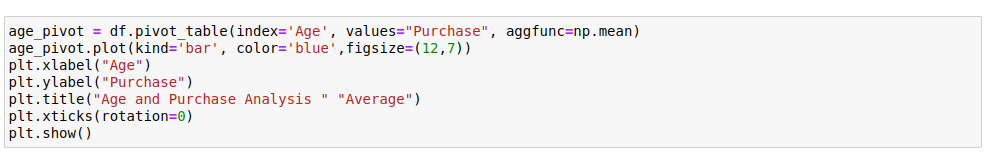
Code image 3: Average purchase for Age
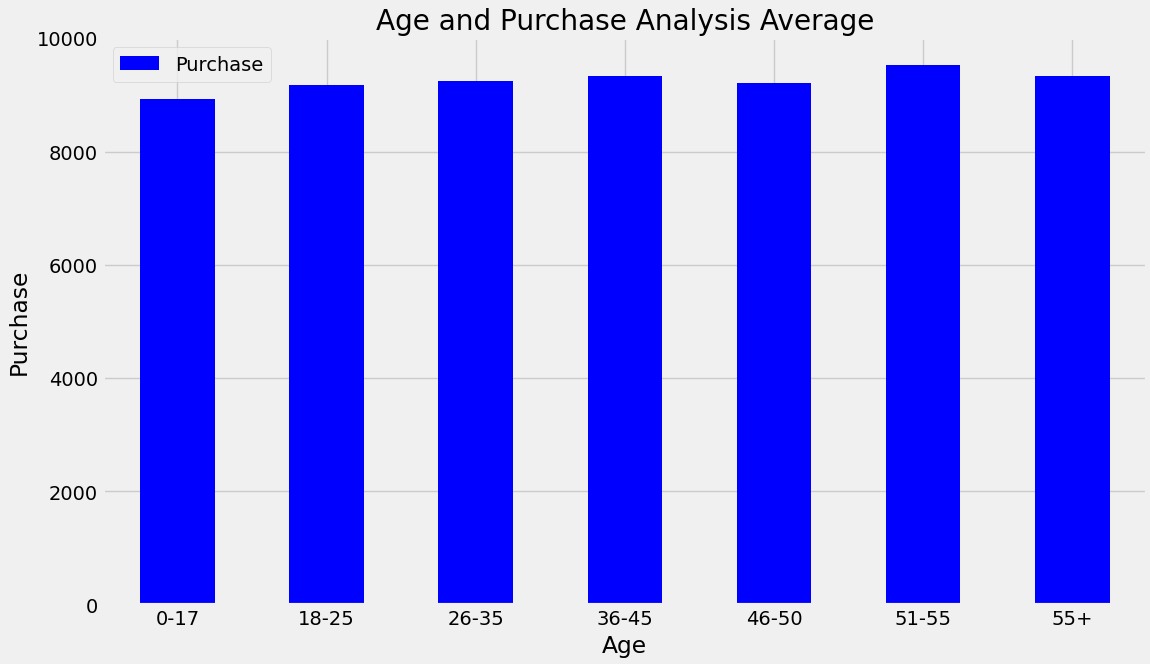
Figure 3: Average purchase for Age
![]()
Code image 4: Count of purchase for Age
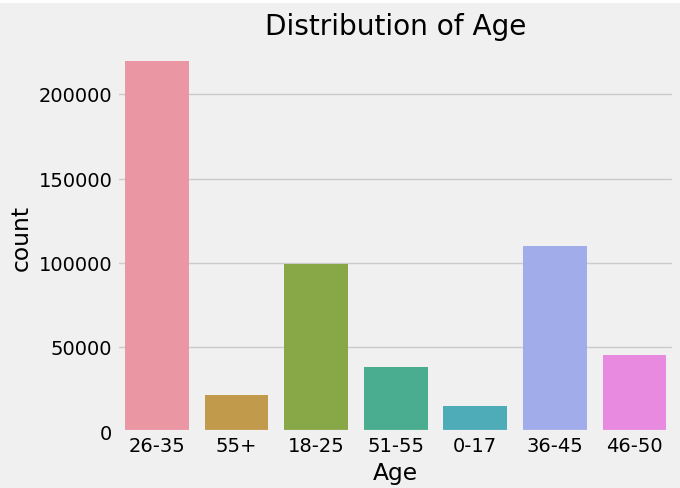
Figure 4: Count of purchase for Age
Customer Insights Based on Marital Status
Singles demonstrated higher spending compared to married individuals, as shown in Figure 5. Code image 5 shows average purchase for marital status. The Code Image 6 & Figure 6 shows the count of purchase for marital status.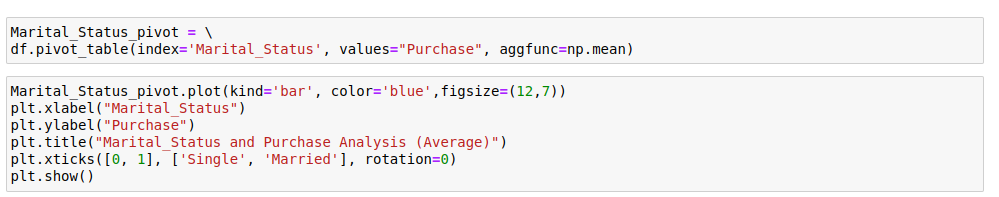
Code image 5: Average purchase for Marital Status
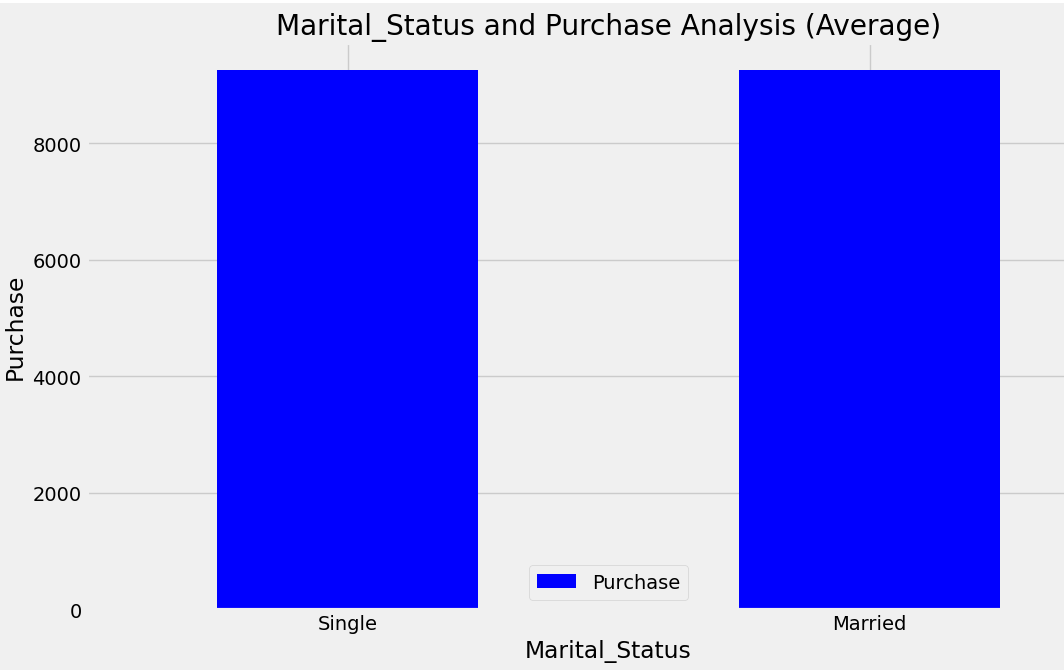
Figure 5: Average purchase for Marital Status
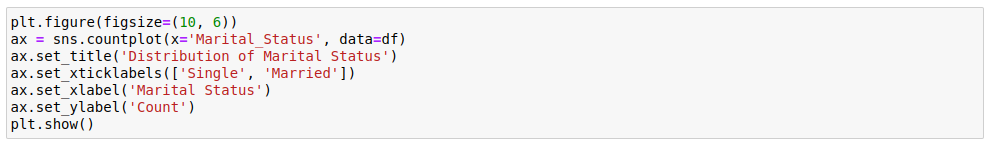
Code image 6: Count of Purchase for Marital Status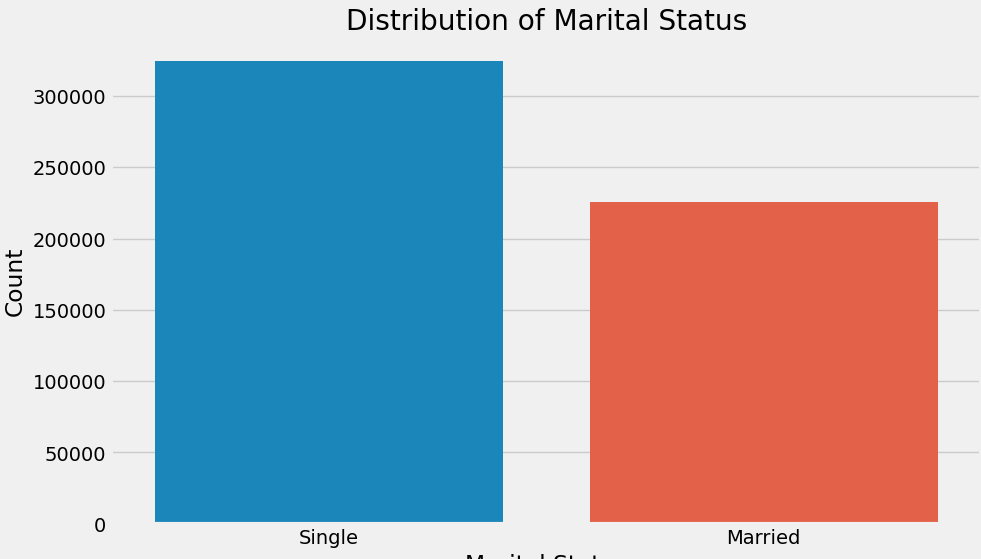
Figure 6: Count of Purchase for Marital Status
Product Insights Based on Product Categories
Attention was prioritised on the product categories with the highest average spending Product Category 1, Product Category 2, and Product Category 3 by implementing stock optimization and targeted promotional activities specifically for these categories. The code image 7 and figure 7 shows the average purchase for product category 1. The code image 8 and figure 8 shows the count of purchase for product category 2.
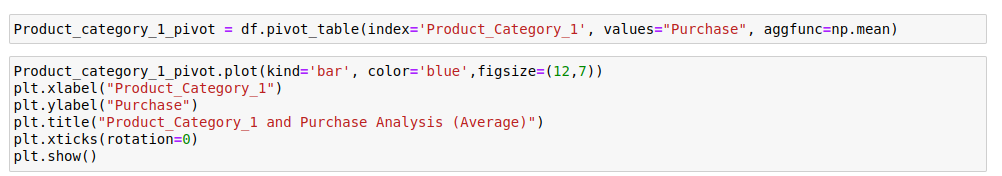
Code image 7: Average Purchase for Product Category 1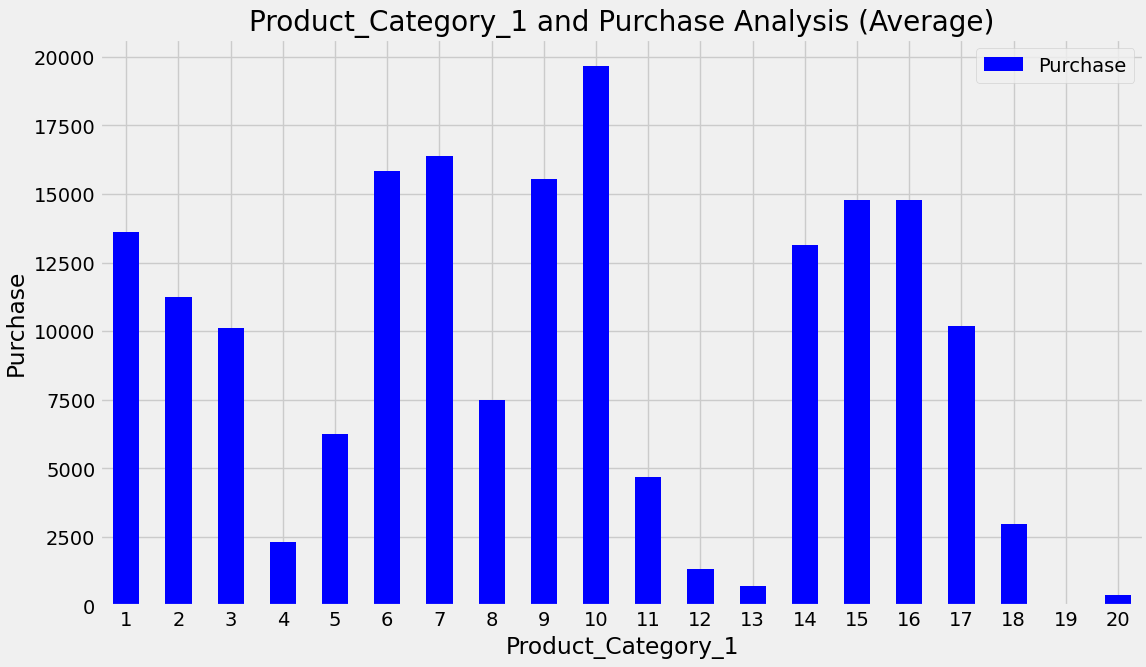
Figure 7: Average Purchase for Product Category 1
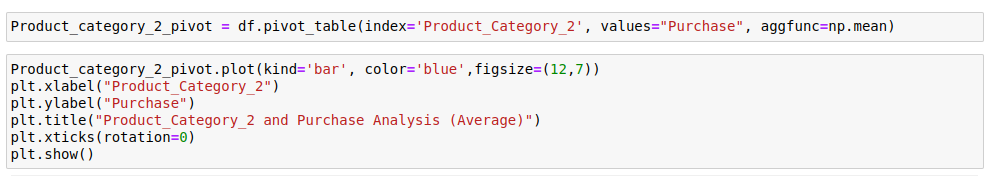
Code image 8: Average Purchase for Product Category 2
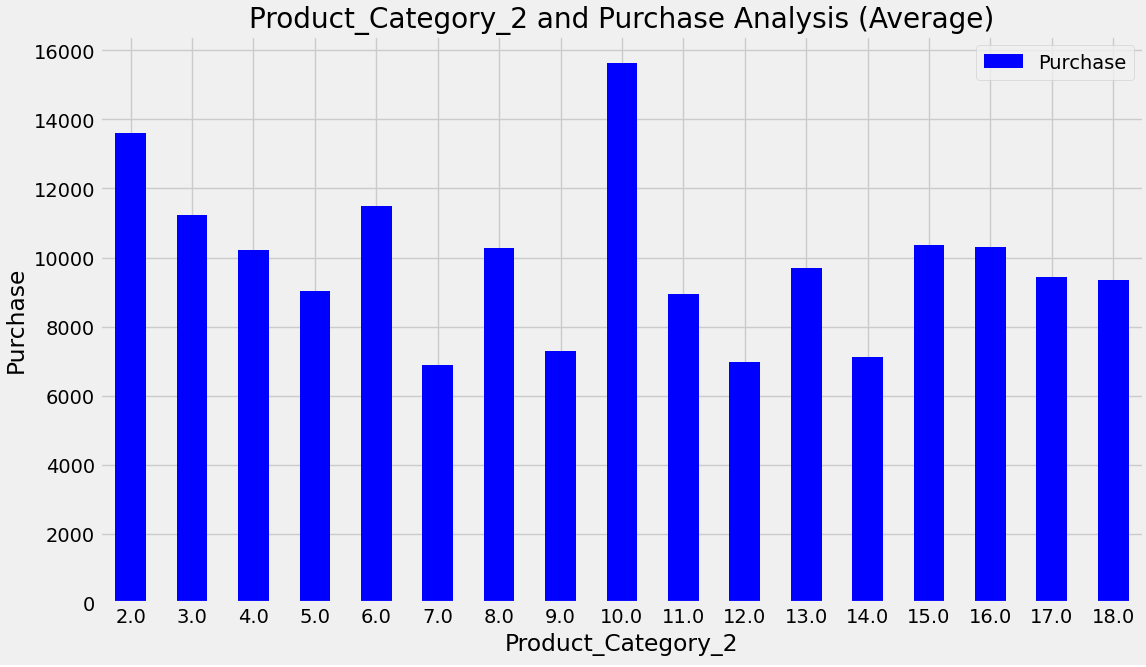
Figure 8: Average Purchase for Product Category 2
Product Insights Based on Product Categories
The strategies used to boost sales in high-value categories characterised by lower sales volumes but higher average purchase values. The code image 9 and figure 9 shows the count of purchase for product category 1. Similarly, the code image 10 and figure 10 shows the count for purchase for product category 2. The code image 11 and figure 11 shows the count for purchase for product category 3.
Code image 9: Count of Purchase for Product Category 1
Figure 9: Count of Purchase for Product Category 1
![]()
Code image 10: Count of Purchase for Product Category 2
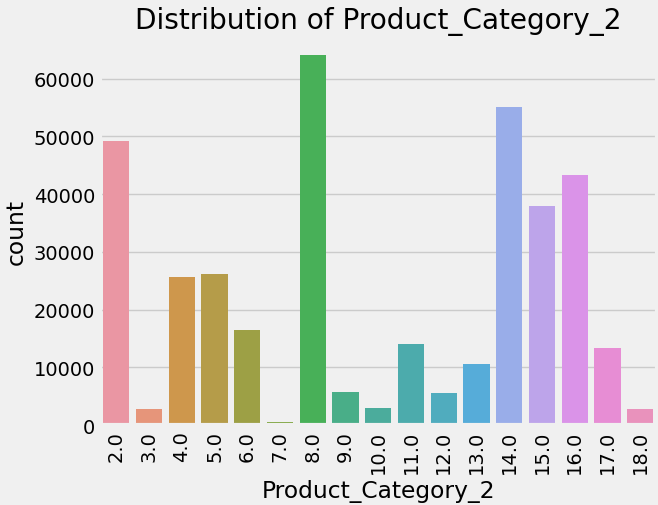
Figure 10: Count of Purchase for Product Category 2
![]()
Code image 11: Count of Purchase for Product Category 3
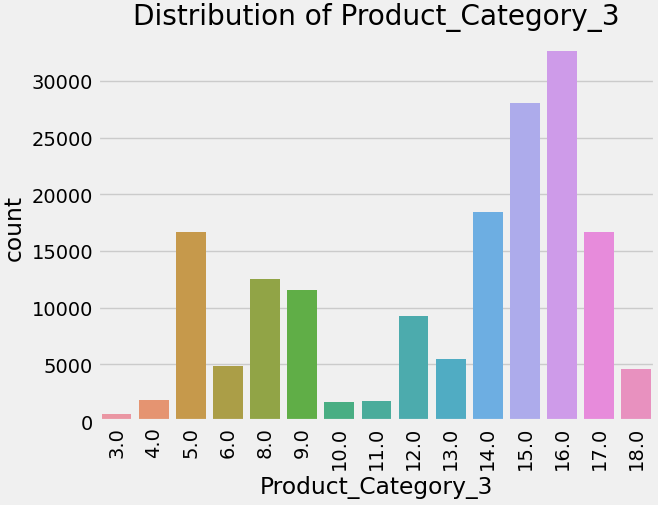
Figure 11: Count of Purchase for Product Category 3
Occupation Insights
Despite occupations 0, 4, and 7 exhibiting higher purchase frequencies, the average spend across occupations remained similar. Occupation-specific marketing campaigns or offers were developed to resonate with each group. The code image 12 and figure 12 shows the average purchase for occupation. The code image 13 and figure 13 shows the count of purchase for occupation.
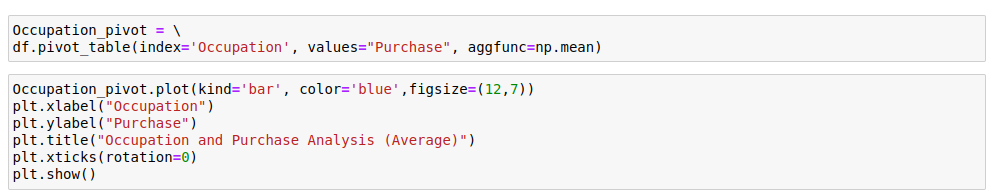
Code image 12: Average Purchase for Occupation
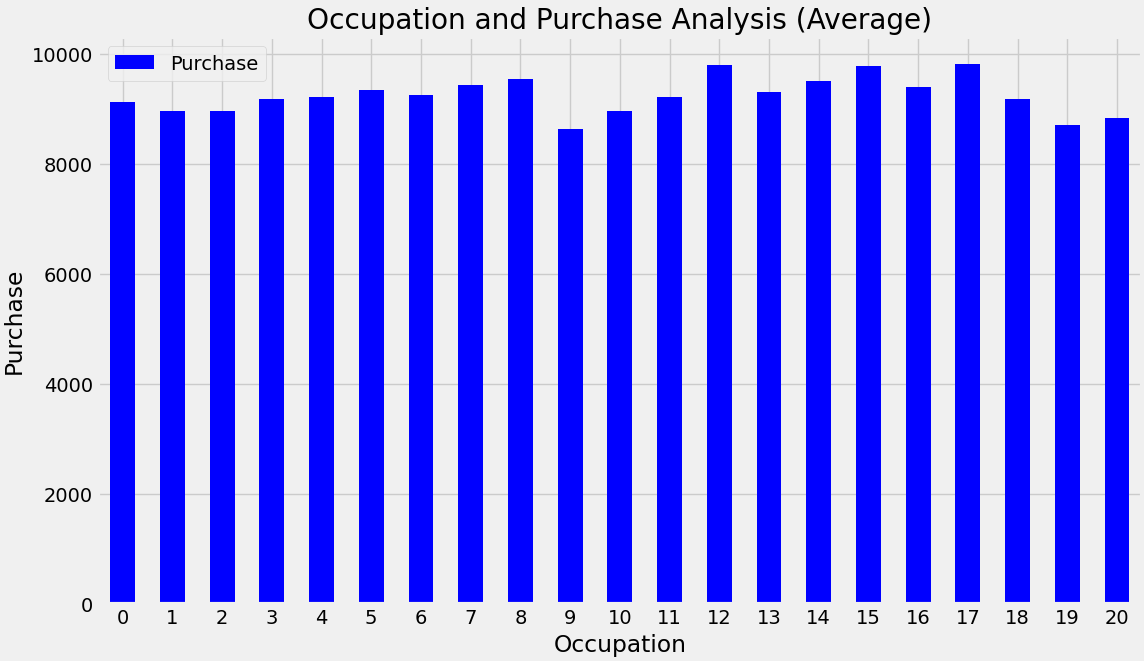
Figure 12: Average Purchase for Occupation
![]()
Code image 13: Count of Purchase for Occupation
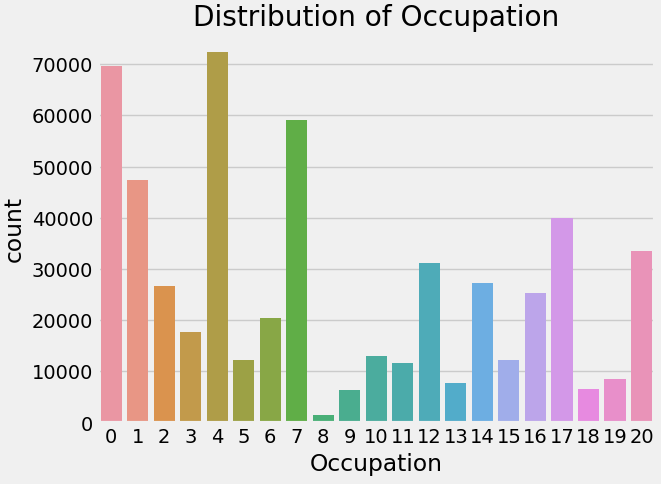
Figure 13: Count of Purchase for Occupation
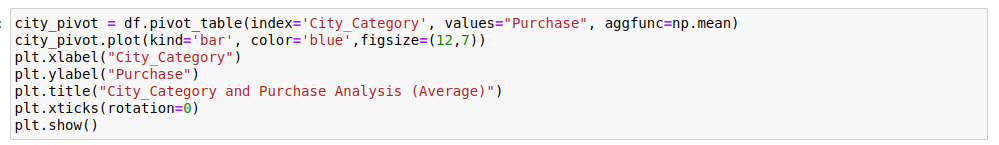
Customer Insights – City Category
Leveraged the higher purchase frequency in City Category B with targeted marketing while focusing on maximising revenue from the higher spending customers in City Category C. The code image 14 and figure 14 shows the average purchase for the city category. The code image 15 and figure 15 shows the count of purchases for the city category.
![]()
Code image 14: Average Purchase for City Category
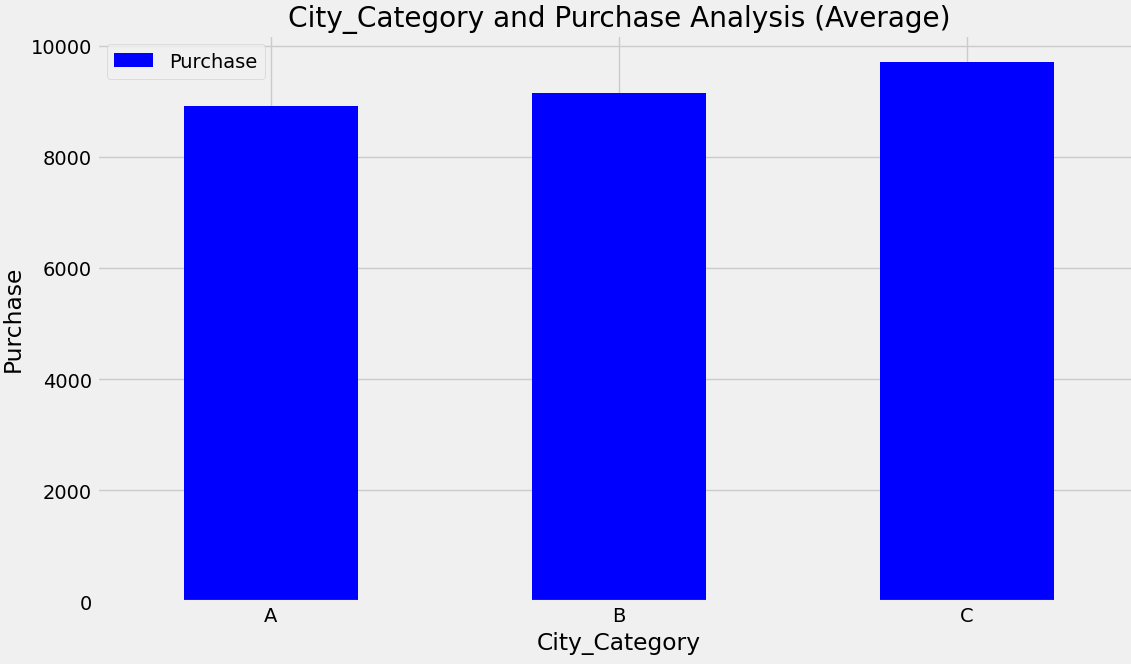
Figure 14: Average Purchase for City Category
Code image 15: Count of Purchase for City Category
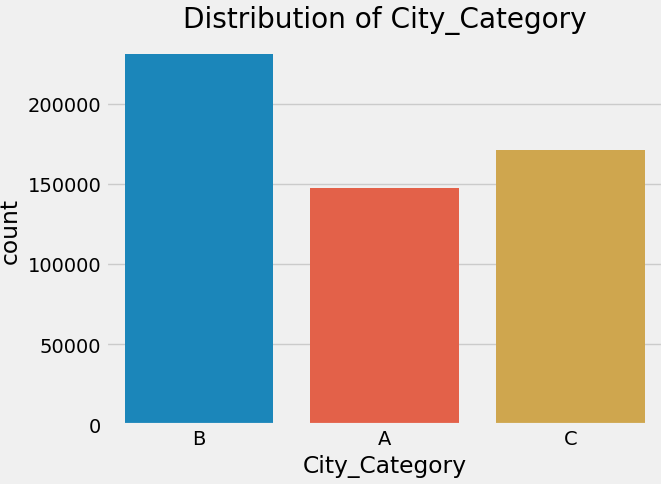
Figure 15: Count of Purchase for City Category
The Decisions Influenced by Data Exploration
The analysis helped the business to identify the right courses of action, enabling data-driven decision-making that promises better results. Some of the decisions made included –
Customer Insights
- Gender: Increased marketing efforts targeting male customers due to their higher spending habits. Explored strategies to boost engagement with female customers.
- Age: Prioritised marketing and product offerings for age groups 26-35, 36-45, and 18-25 based on their spending habits.
- Marital Status: Focused marketing strategies and product offerings on single individuals who demonstrated higher spending.
Product Insights
- Product Categories: Focused attention on categories with the highest average spending (Product_Category_1, 2, and 3) through stock optimization and promotions.
- Product Categories: Explored strategies to boost sales of high-value categories with lower sales volume but higher average purchase values.
Occupation Insights
- Developed occupation-specific marketing campaigns or offers based on purchase frequencies for occupations 0, 4, and 7.
City Category Insights
- Leveraged targeted marketing in City Category B due to higher purchase frequency, while maximising revenue from higher spending customers in City Category C.
Black Friday Decoded: Feature Engineering Analysis of Customer Behaviour
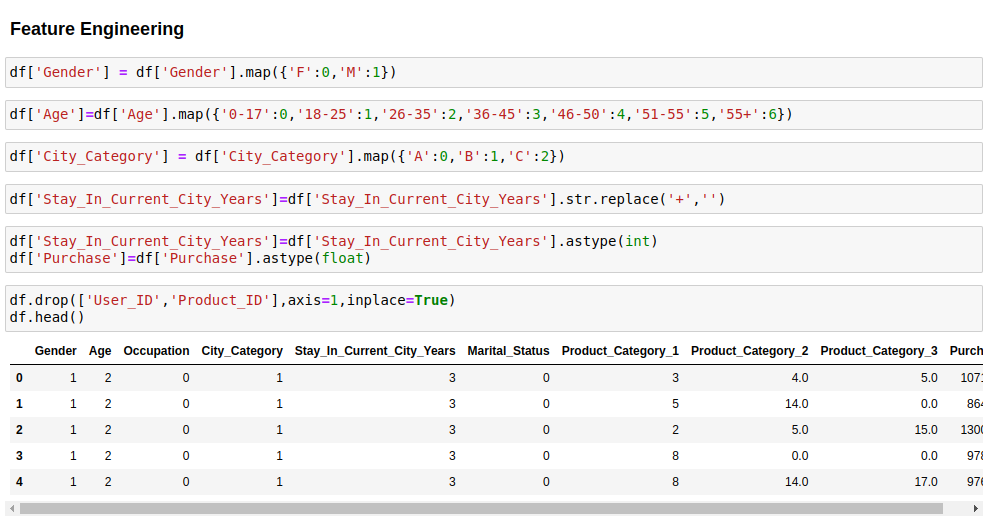
Through the meticulous process of Feature Engineering, pivotal characteristics were extracted and translated into meaningful variables, unravelling the complex dynamics of product demand, pricing strategies, and customer segmentation. The employment of this data-driven methodology empowered retailers with the tools to fine-tune pricing structures, tailor precision-targeted promotions, and ultimately enhanced customer satisfaction amidst the bustling Black Friday retail landscape.
Types of Feature Engineering Performed
To adapt the dataset for predictive analytics, a variety of feature engineering methods were employed. Attributes such as “Gender” and “Age” were converted into numerical values through label encoding, enabling the algorithm to process these categorical variables. The “City_Category” underwent one-hot encoding, which resulted in multiple binary columns each representing a unique city category. In instances of missing data, particularly within “Product_Category_2” and “Product_Category_3”, mode imputation came into play, filling in gaps with the most commonly occurring values, thereby preserving the dataset’s integrity.

Code Image 16: Feature Engineering on Data
The Features Selected for The Model and Why
In the process of developing our machine learning model, a deliberate decision was made to include all available columns as features. This choice stemmed from the observation that the dataset contained a relatively small number of features, and each feature held potential relevance for our predictive task. Given this circumstance, it was paramount to ensure that no valuable information was overlooked or discarded during the modelling process.
Pre-Processing and Data Pipeline
Data from the source system was initially loaded into BigQuery, constituting the full load. Subsequent runs only loaded delta data from the source to the BigQuery dataset. Data was then fetched from BigQuery to construct a model in Vertex AI, with all data preprocessing conducted using the scikit-learn library in Python. User-managed notebooks in Vertex AI Workbench were employed to obtain notebook instances and build the necessary code.
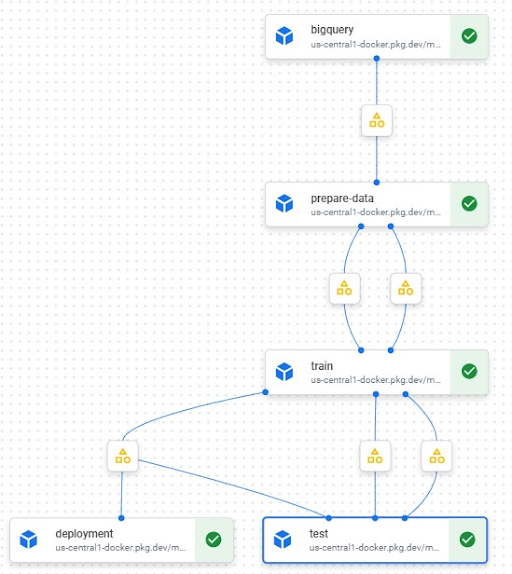
Following the model building, training, and testing phases, the code was Dockerized, and Docker Images were created. These Docker Images were utilised to establish an end-to-end Machine Learning pipeline. This comprehensive pipeline was deployed on Vertex AI pipelines, facilitating the execution of all steps from data ingestion to model creation, including training on new data.
The model lifecycle and deployment were managed using the Vertex AI Model Registry. The trained model was deployed to an API endpoint for real-time predictions.
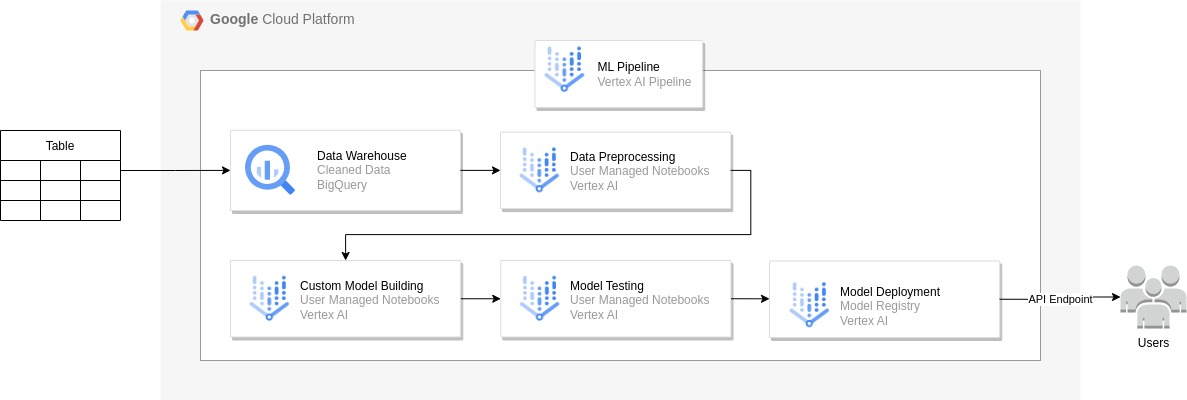
Figure 16: High level GCP Architecture
Machine learning model design(s) and selection
In an effort to solve the problem, 3 models were meticulously evaluated. The winning model was then subjected to further refinement through meticulous hyperparameter tuning, ultimately paving the way for its successful deployment.
The Machine Learning Model Chosen – Gradient Boosting (Regressor)
Upon completing the analysis, Gradient Boosting (Regressor) was identified as the most suitable choice for this ML problem.
Following the evaluation of three regression models (Decision Tree, Random Forest, and Gradient Boosting) using test RMSE and R2 scores, Gradient Boosting stood out as the preferred option, showcasing both competitive performance and interpretability.
Gradient Boosting was chosen as the primary model for subsequent refinement, hyperparameter tuning, and eventual deployment.
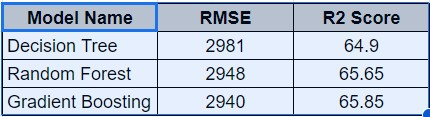
Figure 17: Performance Evaluation
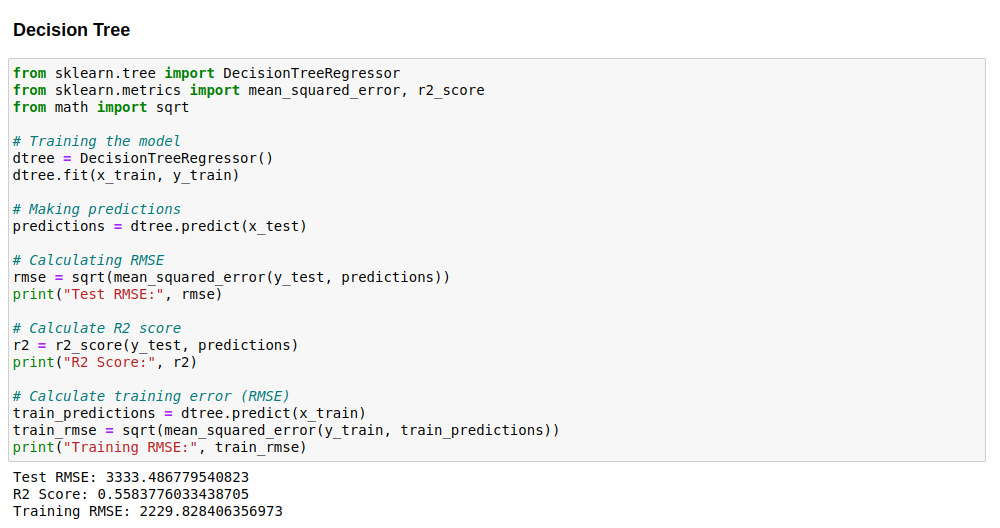
Code image 17: Modeling Data with Decision Tree Algorithm
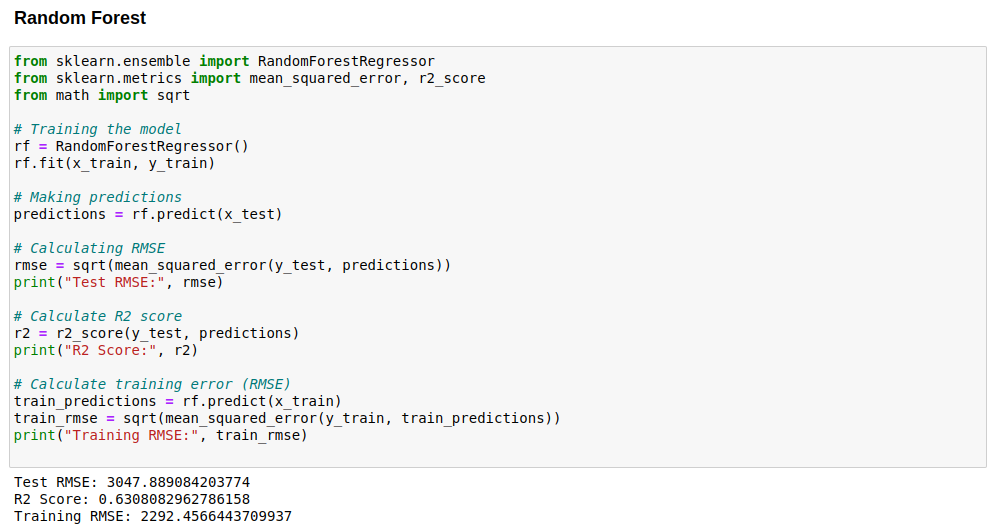
Code image 18: Modelling Data with Random Forest Algorithm
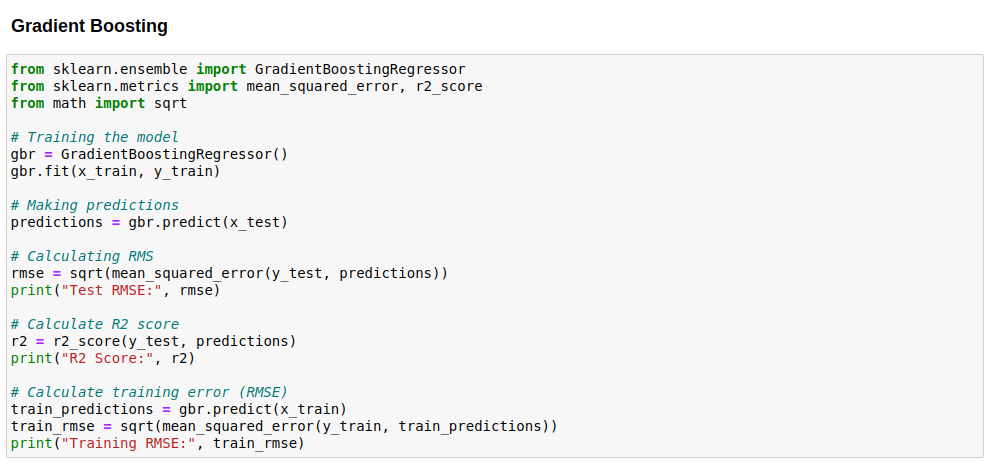
Code image 19: Modelling Data with Gradient Boosting Algorithm
The Criteria Used for Machine Learning Model Selection
The criteria for selecting the machine learning model involved a systematic evaluation of various algorithms based on their performance metrics. Initially, we experimented with Decision Tree, Random Forest, and Gradient Boosting models, assessing their accuracy and root mean square error (RMSE) on our dataset. The Decision Tree model yielded an accuracy of 0.649 with an RMSE of 2981.27, while the Random Forest model showed slightly improved performance with an accuracy of 0.656 and an RMSE of 2948.93. However, it was the Gradient Boosting model that exhibited the most promising results, achieving the highest accuracy of 0.658 with the lowest RMSE of 2940.67 among the tested algorithms.
After careful consideration of these metrics and thorough experimentation, we concluded that the Gradient Boosting model provided the optimal balance of accuracy and precision for our specific predictive task, thus warranting its selection as the final model for deployment.
Machine Learning Model Training and Development
- The model was deployed to the endpoint for online predictions.
- The data was divided into two datasets, namely training and testing, in BigQuery.
- Subsequently, the data underwent treatment for outliers and null imputation.
- Following this, the feature variables underwent preprocessing.
- During the preprocessing phase, data imputation and feature scaling were executed.
- For feature scaling, standardisation was applied using StandardScaler.
- The processed dataset was employed to train the Gradient Boosting model.
- The model was then saved to the GCS Bucket with a Pickle File for endpoint deployment, facilitating online predictions.

Figure 18: VertexAI MLOps Pipeline
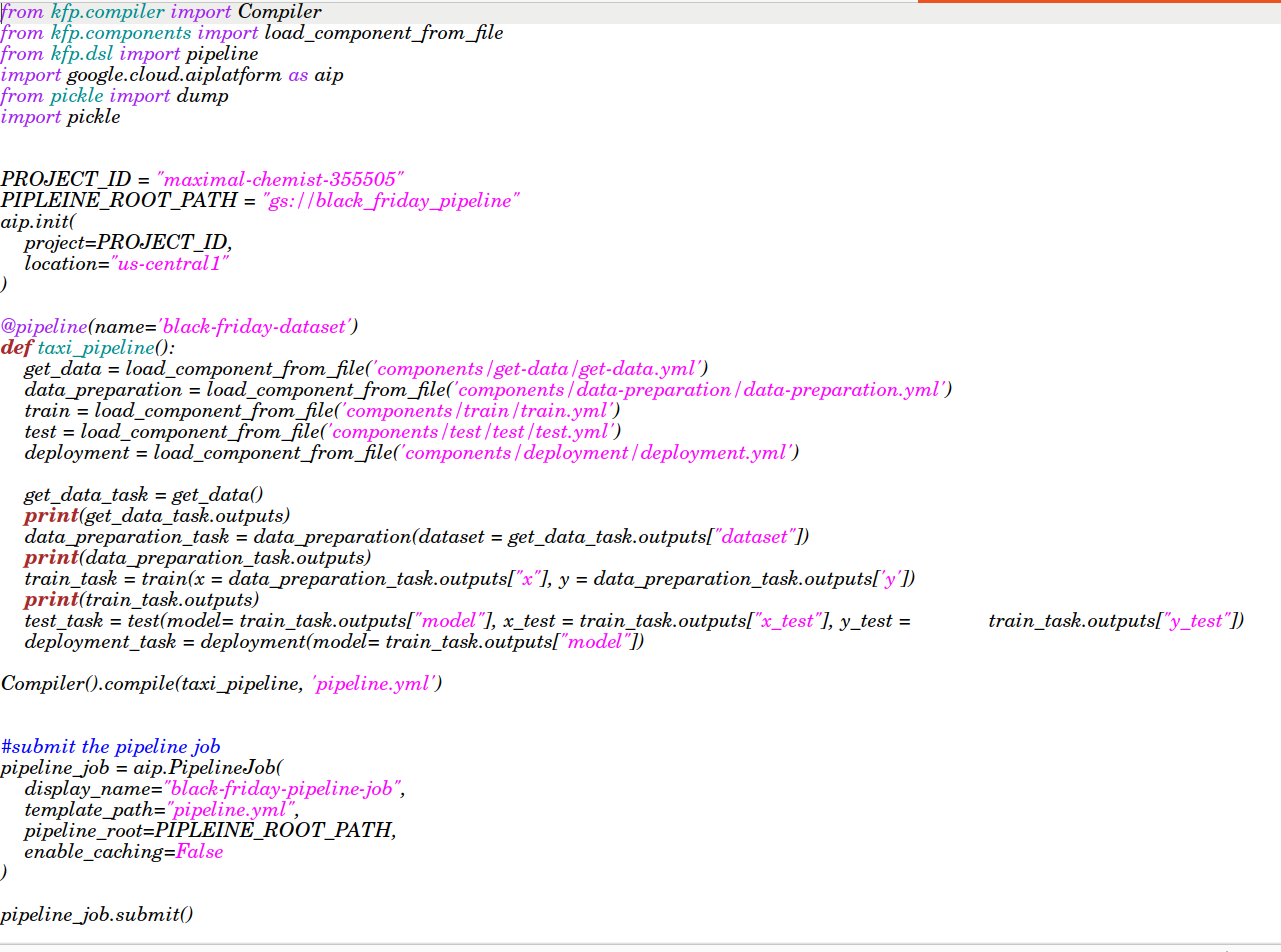
Code image 20: VertexAI MLOps Pipeline
Dataset Sampling Used for Model Training
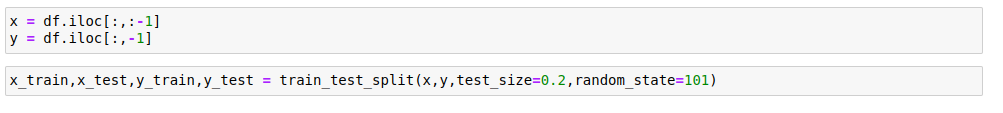
Code Image 21: Train Test Split
For model training, the dataset was partitioned into training and testing sets using a common practice of an 80-20 split, where 80% of the data was allocated for training and the remaining 20% for testing. The target column, “Purchase,” was designated as the variable to be predicted.
Google Cloud Best Practices for Distribution, Device Usage and Monitoring
In aligning with Google Cloud best practices, our project utilised Vertex AI for an efficient training pipeline. We optimised device usage by selecting CPU-based resources, including EC2 instances, tailored to our models—Decision Trees, Random Forests, and Gradient Boosting. Optimising for device utilisation, an e2 machine (a machine type optimised for memory-intensive workloads) was selected. Scalability was further achieved by scaling by adding more machines of the same type, increasing the training module’s capacity. This strategic allocation ensured scalability and efficiency, while ongoing monitoring maintained performance throughout the training process.
Optimal Model Evaluation Metric Aligned with Business Goals
The selection of evaluation metrics like accuracy and RMSE aligns with the goal of predicting purchases in a Black Friday dataset. Accuracy measures the model’s correctness in predicting purchases, vital for maximising correct predictions. Meanwhile, RMSE quantifies prediction errors in purchase amounts, crucial for optimising revenue generation and resource allocation during sales events. These metrics collectively support informed decision-making, ensuring alignment with business objectives.
Hyperparameter Tuning and Model Performance Optimization
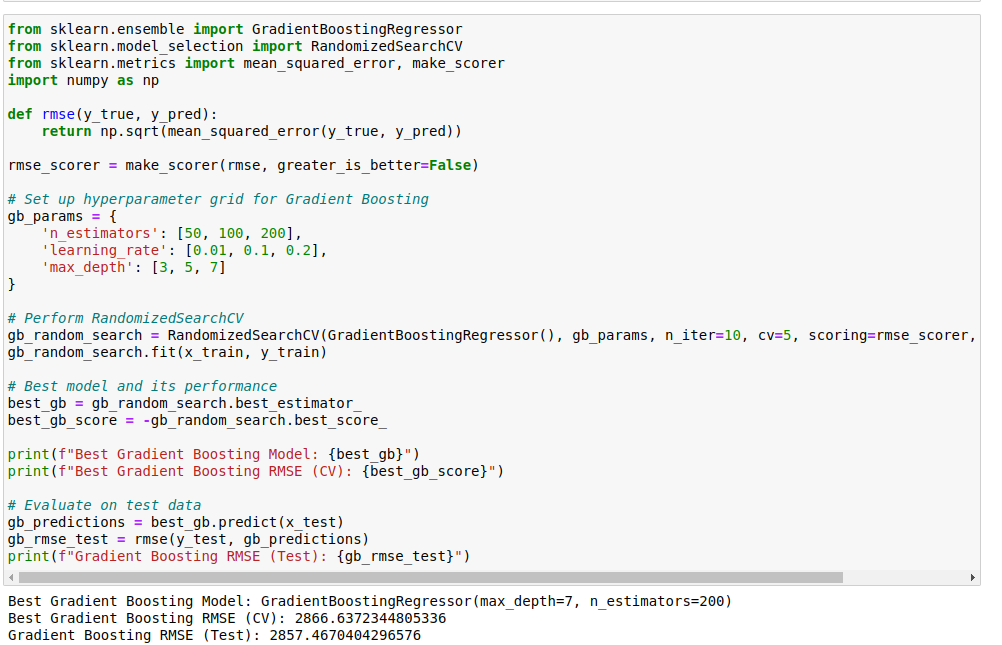
Code image 22: Hyperparameter Tuning for Gradient Boosting Algorithm
Hyperparameter tuning was executed on the Gradient Boosting model, resulting in the attainment of the following optimised configuration.
- The best Gradient Boosting Model, identified as GradientBoostingRegressor, featured parameters max_depth=7 and n_estimators=200.
- The hyperparameter tuning process led to an enhancement in model performance, evidenced by the subsequent results.
- The best Gradient Boosting RMSE (Cross-Validation) was recorded at 2866.64, and the Gradient Boosting RMSE on the Test Set was noted as 2857.47.
These outcomes affirmed that the tuned Gradient Boosting model proved well-suited for the regression task, showcasing a harmonious balance between predictive accuracy and model interpretability, rendering it ready for deployment.
Determining Variances and Optimising ML Model Architecture
In addressing variance and optimising the ML model architecture for our simple machine learning problem, we employed strategies tailored to the nature of the task and the models utilised. Given the inherent simplicity of the problem and the modest accuracy achieved from the outset (approximately 65%), concerns regarding overfitting and underfitting were minimal. To maintain a balance between bias and variance, we employed gradient boosting, a robust ensemble method known for its ability to generalise well to various datasets. Additionally, we fine-tuned hyperparameters using techniques like grid search to optimise model performance further. While our approach didn’t necessitate extensive measures to mitigate variance, the careful selection of a suitable algorithm and hyperparameter tuning ensured a well-performing and robust ML model architecture for our specific problem domain.
Evaluating the Chosen Machine Learning Model
- Online prediction played a crucial role in offering real-time predictions that proved instrumental in making timely decisions.
- The Vertex AI pipeline facilitated model deployment for consumption in real-time predictions.
- A Curl command was utilised to obtain online predictions.
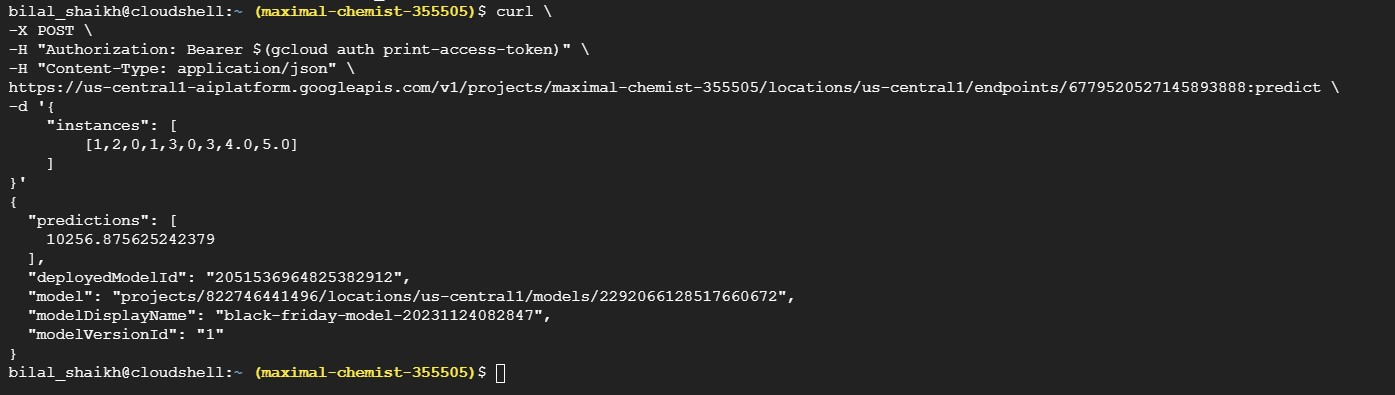
Figure 19: Deployment Status
Fairness and Bias Implications in a Profit Maximization Model
Based on our comprehensive analysis, we have devised a target marketing strategy to maximize engagement and profitability. We can segment and target the customers effectively by intensifying marketing efforts towards male customers, who exhibit higher spending habits, through personalized email campaigns, social media ads, and exclusive promotions focused on their preferred categories, such as electronics and sports equipment. Simultaneously, boosting engagement with female customers through personalized recommendations, loyalty programs, and special events like women-only shopping nights. For age-based targeting, the priority will be on marketing and product offerings tailored for age groups 18-25, 26-35, and 36-45, leveraging age-specific social media platforms, influencers, and content marketing. Additionally, there could be targeted promotions and discounts during key life events. For single individuals, there could be promotional products and experiences catering to singles, such as solo travel deals and self-care products.
From a product strategy perspective, focusing on high-spending product categories, specifically Product Categories 1, 2, and 3, by optimizing stock levels, highlighting these products in marketing materials, and running special promotions to boost sales. This will also boost sales of high-value categories with lower sales volume but higher average purchase values by developing premium bundles, offering exclusive deals, and creating compelling marketing content. In terms of occupation-specific marketing, there could be targeted campaigns for occupations 0, 4, and 7 based on purchase frequencies, tailoring messages and offers to resonate with their professional needs and interests.
The city category strategy will leverage targeted marketing in City Category B, where purchase frequency is higher, using geo-targeted ads, local influencers, and community events to increase engagement. In City Category C, there could be maximizing the revenue from higher spending customers by focusing on high-end products, premium services, and exclusive events that appeal to affluent customers, coupled with a loyalty program offering tailored benefits.
Lastly, implementing an integrated marketing approach across all channels—online, in-store, and mobile—ensures consistent messaging, personalized offers, and seamless customer experiences. By leveraging data from customer interactions, one could continually refine and personalize marketing efforts. Enhancing customer loyalty programs can increase retention and lifetime value, offering rewards, exclusive discounts, and personalized experiences based on purchase history and preferences.
Including purchaser demographics in our model for targeted marketing offers both opportunities and challenges. On one hand, demographic data helps to create highly personalized and relevant marketing strategies, thereby increasing customer engagement and satisfaction. On the other hand, it raises concerns about fairness and bias. To assess and ensure fairness in models, especially those used for critical decision-making processes like profit prediction in targeted marketing, it is imperative to test for bias. One effective method to achieve this is by comparing the model performance with and without demographic features. In our analysis, we evaluated a Gradient Boosting Regressor’s performance with the inclusion of demographic attributes such as gender, age, occupation, city category, and marital status, and compared it to the model’s performance without these attributes.
When demographic features were excluded, the model achieved a performance score of 65.4.
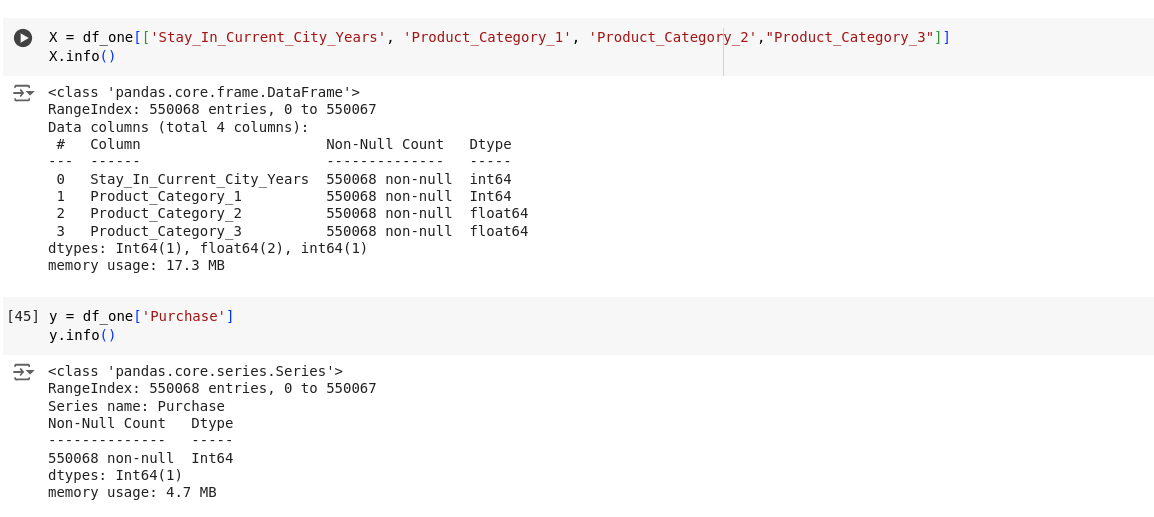
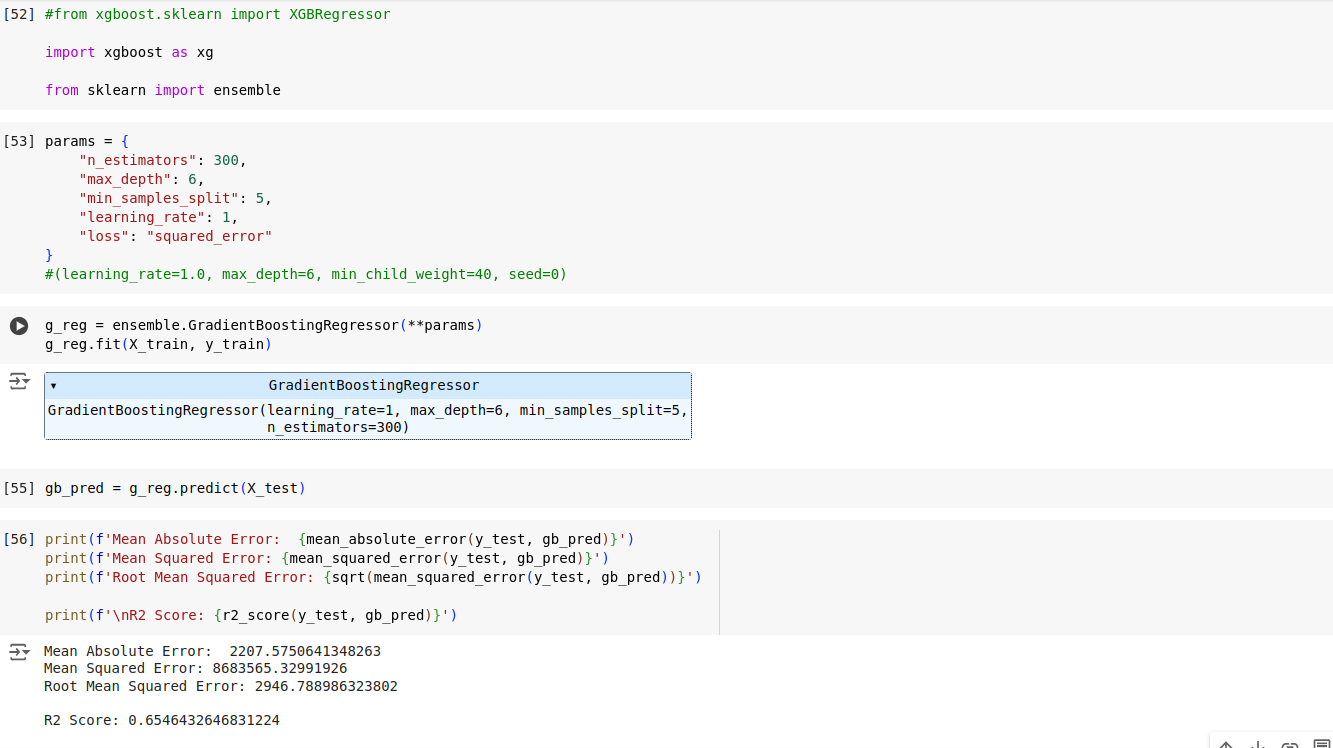
Figure 20 : Model performance without demographic features
By including demographic features, the performance improved slightly to 65.8. This comparison serves as a fairness indicator, highlighting the impact of demographic information on the model’s predictions.
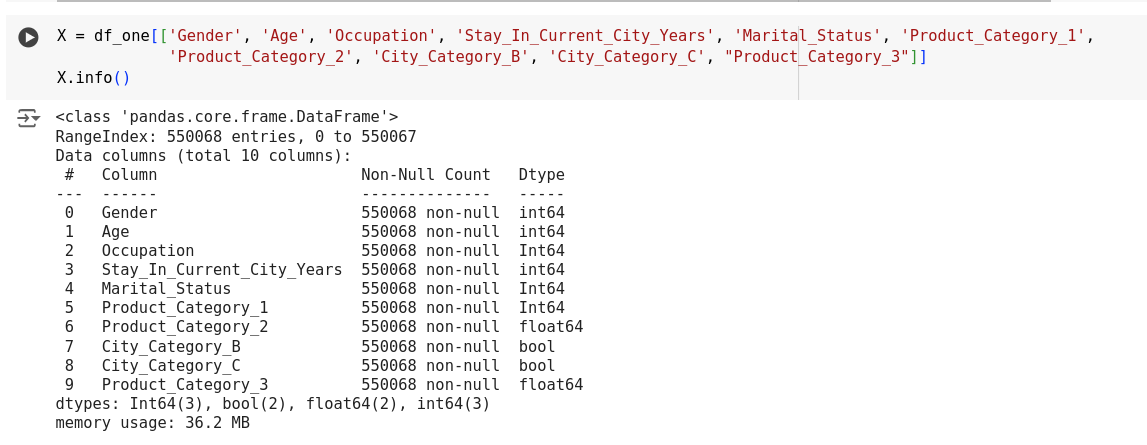
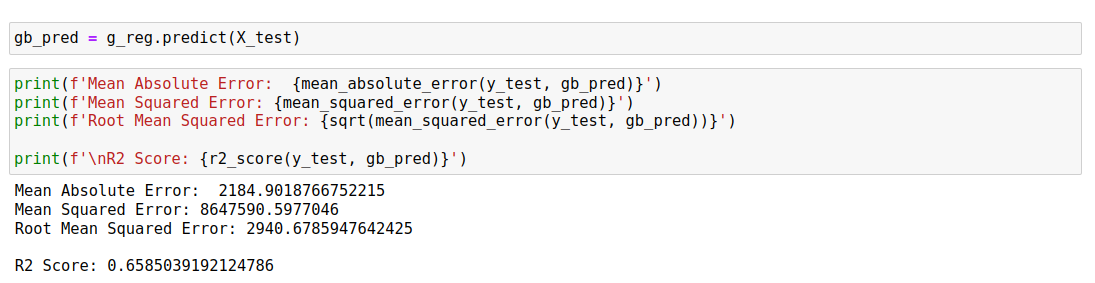
Figure 21 : Model performance with demographic features
The slight improvement in performance with the inclusion of demographic features suggests that these attributes contain relevant information that can enhance the model’s accuracy. However, this also raises concerns about potential biases the model might learn from these demographic attributes. The higher performance score with demographics could indicate that the model might rely on demographic characteristics in ways that could perpetuate or amplify existing biases. To ensure fairness in profit prediction models used for targeted marketing, it is essential to not only test for bias but also actively mitigate it. One effective method to achieve this is by using MinDiff (Minimum Disparity) to equalize the profit predictions across various demographic characteristics. This approach ensures that the model’s predictions do not favor or disadvantage any particular group.
In our analysis, we applied MinDiff to a Gradient Boosting Regressor to mitigate potential biases related to demographic characteristics such as gender, age, occupation, city category, and marital status. The MinDiff technique adjusts the model training process to minimize the disparity in predictions between different demographic groups.
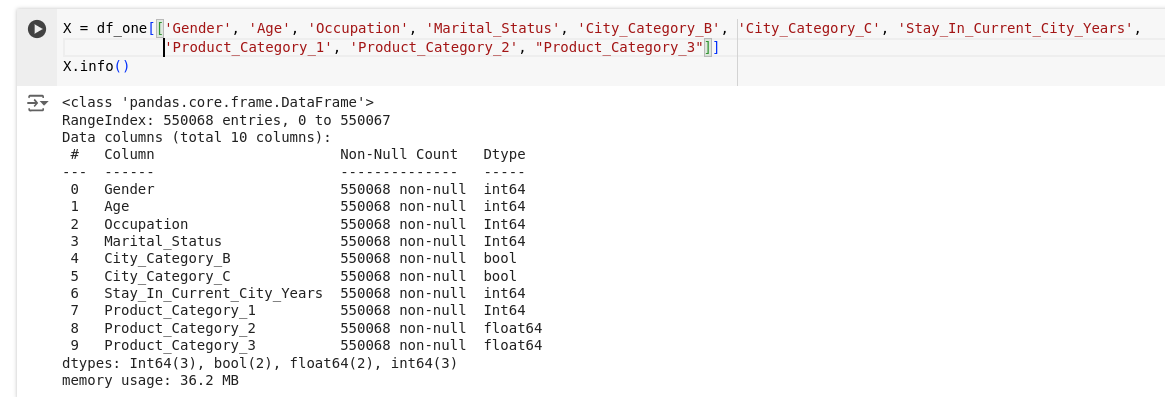
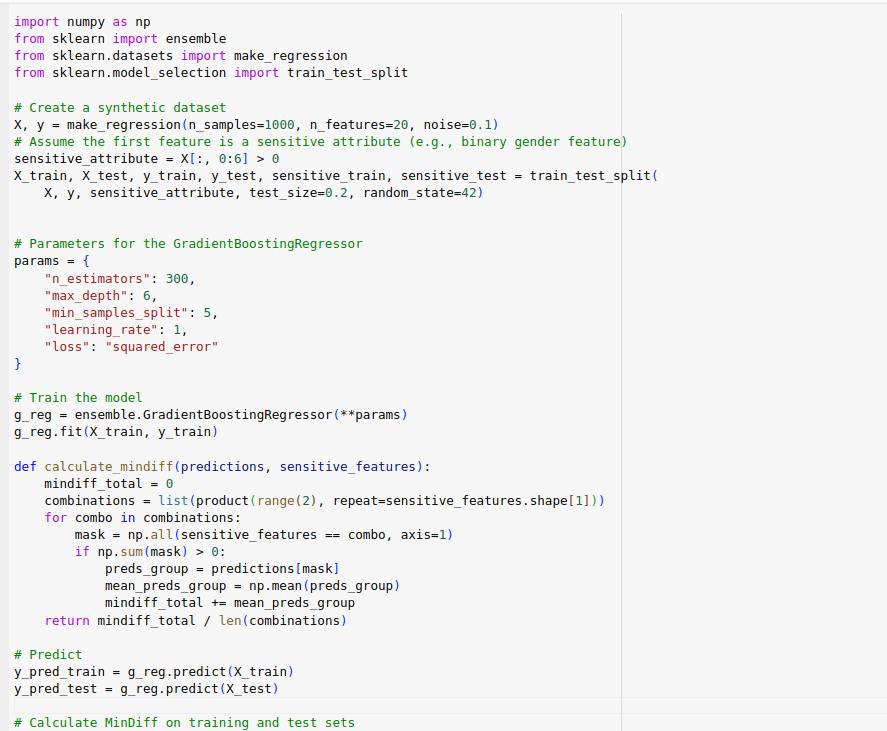
Figure 22 : Code snippet to evaluate the fairness and bias using MinDiff for Gradient Boost Regressor
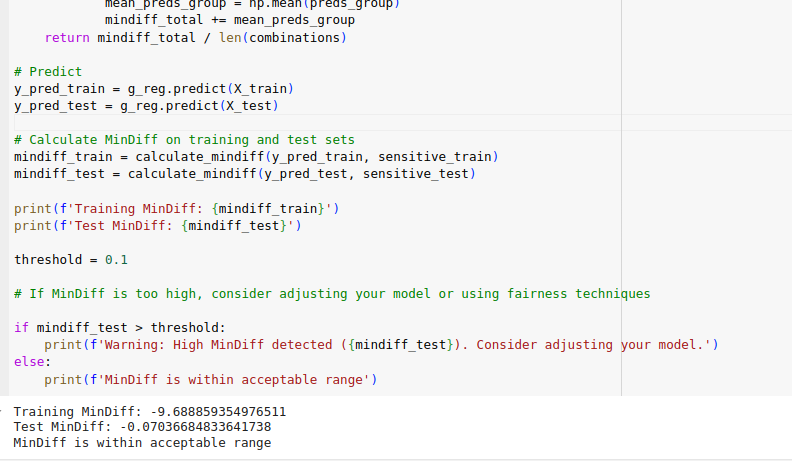
Figure 23: Code snippet to evaluate the fairness and bias using MinDiff for Gradient Boost Regressor
After implementing MinDiff, we evaluated the fairness of our model by calculating the MinDiff metric on both the training and testing datasets. For the training data, the MinDiff was found to be -0.0704, and for the testing data, it was -9.688. These values were compared against a predefined acceptable threshold of 0.1. Both MinDiff values were within the acceptable range, indicating that the model’s predictions are equitable across different demographic groups. The negative MinDiff values suggest that the disparity in profit predictions between demographic groups is minimal, thereby ensuring that no group is significantly favoured or disadvantaged. This outcome demonstrates that the model is fair and does not propagate biases related to demographic characteristics.
By comparing model performance with and without demographics, and incorporating fairness metrics, we can strike a balance between model accuracy and equitable treatment of all demographic groups. Testing for bias by comparing model performance with and without demographic features provides valuable insights into the model’s behaviour and potential biases. It allows us to ensure that any improvements in performance do not come at the expense of fairness, thereby promoting ethical and unbiased decision-making in predictive modelling.
Conclusion: Analyse Faster and Predict Profits Accurately
In conclusion, our exploration into applying machine learning techniques to analyse the Black Friday dataset underscores the profound impact these technologies are poised to make across diverse industries. Through predictive modelling, we’ve harnessed the power of data to anticipate consumer behavior and forecast purchase patterns with remarkable accuracy. This not only empowers businesses to tailor offerings to individual preferences but also fosters customer trust and loyalty, driving sustainable growth and profitability. The Black Friday dataset serves as a compelling example of how machine learning can revolutionize decision-making processes, enabling organizations to unlock valuable insights and drive innovation.
As we look ahead, the transformative potential of machine learning extends far beyond retail, spanning sectors from healthcare to finance, and manufacturing to entertainment. Embracing these technologies and integrating them into everyday operations will be key to staying competitive in an increasingly data-driven world. This journey into predictive analytics on Black Friday serves as a testament to the limitless possibilities that lie ahead as we continue to leverage the power of machine learning to drive business success and societal advancement.